5 Best Practices for Data Visualisation in 2022
Data visualisation is a technique of translating raw data into visual presentations like maps, charts, and graphs. Its objective is to communicate information efficiently to readers.
Read More

Data visualisation is a technique of translating raw data into visual presentations like maps, charts, and graphs. Its objective is to communicate information efficiently to readers.
Read More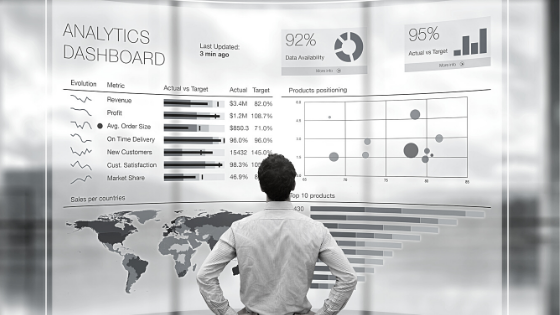
Predictive modelling is a process used in business analytics to predict the probability that an event will occur by analysing historical data. This could help you understand the potential future outcomes of something like a customer buying, a candidate being hired, a sales team meeting a target. Predictive modelling is often used to help build better business decisions.
Read More


 Managing Your Business Mindset eBook - Clive Enever
$9.95
Managing Your Business Mindset eBook - Clive Enever
$9.95
 Customers - The Heart of Every Business eBook - Clive Enever
$9.95
Customers - The Heart of Every Business eBook - Clive Enever
$9.95
 Create A Winning Business Built On The People You Hire eBook - Clive Enever
$9.95
Create A Winning Business Built On The People You Hire eBook - Clive Enever
$9.95
 Sales Without The Hard Sell eBook - Clive Enever
$9.95
Sales Without The Hard Sell eBook - Clive Enever
$9.95
 Copywriting Frameworks Toolkit - eBook
$9.97
Copywriting Frameworks Toolkit - eBook
$9.97